
PUBLISHED ARTICLES
Published in Workers’ Comp News, Volume 2, Issue 4,
September/October 1997
By: Gary W. Kern, ARM
The Effects of Adjuster Case Load Size on File Closure Rates, Cost per Closed Claim and Ultimate Claim Cost – A Case Study.
This case study was started on September 1, 1994, and continued through December 31, 1996, with modifications. During this time period, steps were taken to reduce the claims adjuster’s average caseload. Additional steps were taken to allow the adjuster to specialize in specific areas of claims management or task management. The claims adjuster’s functions were broken down into three phases: the investigations phase, the medical management/return to work phase, and the resolution/litigation management
phase.
The client in this case study is a self-insured fund, with high exposure job classifications. Most members of the association did not have an in-house risk manager. The Third Party Administrator provided basic safety and claims management services. The adjuster-to-claims ratio is determined by multiplying the number of adjusters employed by the TPA, by the number of months the adjuster worked for the TPA during the calendar year. This product is then divided by 12. This calculation gives us the average number of adjusters available during the calendar year. The actual number of reported Lost Time Claims is divided by the number of adjusters; the product is a ratio of adjusters to reported claims. (This ratio does not represent the actual number of files handled by an adjuster during a calendar year)
A normal claims management approach is to have a claims supervisor manage teams of two to four adjusters. The supervisor reviews all new losses and assigns the case to an adjuster for handling. The adjuster is required to report back to the supervisor in various ways. The adjuster is expected to manage the file from assignment to closure.
This was the approach used prior to September 1, 1994.
A modified approach was developed and started in September of 1994. In the modified approach, the supervisor actually manages the file during the first 60 days of a claim’s life. The supervisor conducts a compensability investigation, identifies subrogation and second injury fund issues, makes the initial compensability decision, and starts benefits.
After the supervisor makes an affirmative compensability decision an action plan is written and the claim file is transferred to a Return-to-Work Adjuster. The Return-to-Work Adjuster implements the action plan and manages medical and return to work issues. Cases that present difficult to resolve issues or litigation disputes are transferred
to a Resolution Manager (working adjuster). This approach allows the more experienced adjuster to deal with the more complex issues and the less experienced adjuster to
concentrate on specific medical and return to work issues.
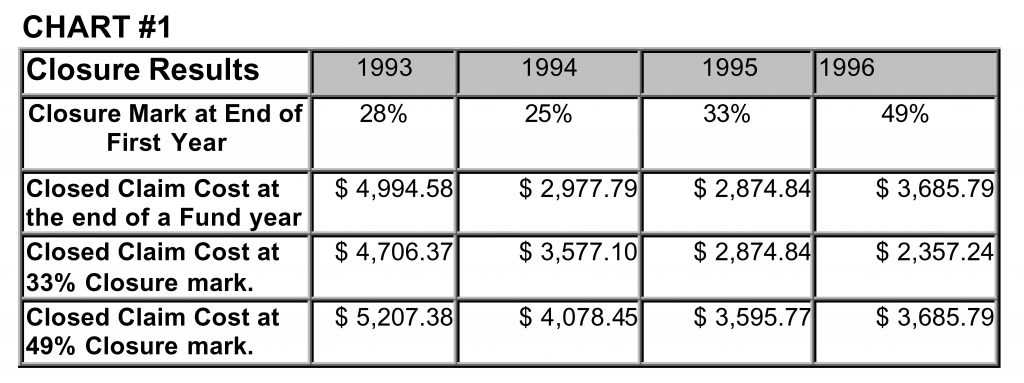
In 1993 the ratio of new lost-time claims per adjuster was 236; in 1994 it was 234; in 1995 the ratio decreased to 132.3 and in 1996 to 85. Between 1993 and 1996 the ratio of claims to adjuster was reduced by 278%. Remarkably, the accident year closure rate went from 28% in 1993 to 49% in 1996. That is a 75% increase in the overall closure rate. What effect does this have on the average cost of a claim? Chart # 1 shows the average cost of the closed claim from several points of view. Regardless of the circumstances, Chart #1 indicates that the faster one closes a claim the less it is going to cost. For example, 28% of the new claims reported in 1993 were closed in 1993 for an average cost of $4,994.58. In 1995 the closure rate increase by 5%, while the average claims cost decreased by 17% to $2,874.84. In 1996 the closure rate increased to 49% but the average cost per claim increased from $2,874.84 to $3,685.79. Why? Quite simply the greater the closure rate the closer one comes to the ultimate claims cost, and a higher average closed claim cost. The ultimate claims cost is the total cost of all claims at the 100% closure mark. For example, the ultimate cost of all claims reported in 1993 can not be known until all 1993 claims are closed. Since we are controlling the adjuster-to-claims ratio, we must compare claims cost at the same closure point. In other words, what was the cost of 1993 claims at the 33% closure mark or the cost of 1995 claims at the 49% closure mark? Chart # 1 gives us the answers. The closure rate increased each year from 1993 through 1996. When we compare closed file cost at the 33% closure mark we find that 1996 claims cost less than 1995 claims; which cost less than 1994 claims; which cost less than 1993 claims. This same pattern is seen when we compare closed claim costs at a 49% closure mark.
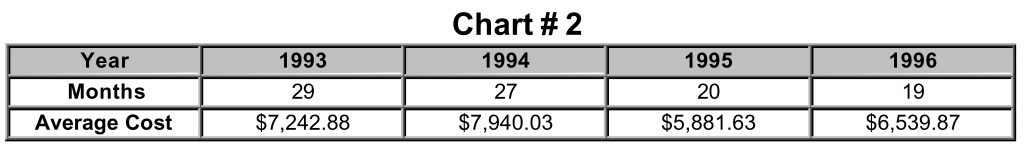
Will this cost savings pattern continue when higher closures are reached? Chart # 2 shows the four accident years at the 71% closure mark. It took 29 months to reach 71% closure on 1993 claims but only 19 months to reach 71% closure on 1996 claims. This chart shows that both 1995 and 1996 reached closure more than six months faster than in 1993 or 1994. The average closed claim cost for 1995 and 1996 is lower than in 1993 or 1994. In 1996 a $1,400.16 per claim savings was achieved when compared against the
1994 closed claim cost. Thus, for every 100 files handled, $140,016.00 was saved.
The message for claims managers is simple, reduce your adjuster’s claims loads and the average cost of a client’s claims will decrease. Claims managers need to determine the optimum adjuster caseload. An Educated Guess Model is one method for getting an immediate answer. The claims managers must answer six basic questions. The questions will fit nicely into the columns of a spreadsheet.
Column 1) What task (activities) are relevant in the management of the claim?
Column 2) Who will or can perform each task, i.e., a claims assistant, adjuster, supervisor, litigation manager, etc.?
Column 3) Estimate the percentage of files that will require the performance of a given task.
Column 4) Estimate the number of times the task will be performed on each file.
Column 5) Estimate the amount of time needed to complete the task each time it is performed.
Column 6) Calculate the time needed to complete the tasks on one file.
For Example:
Column 1) Index injured worker for prior accidents or claims (Fraud Check)
Column 2) Adjuster or Claims Assistant
Column 3) 100% of all lost-time claims & all medical-only claims with back or knee injuries
Column 4) 1.3 times per claim
Column 5) 12 minutes
Column 6) 100% x 1.3 x 12 = 15.6 minutes per file
This method was used for the case study. One hundred and forty (140) tasks were identified. Each task required an investment of an adjuster’s time. The model used in the case study predicted that it would take 9 hours of the adjuster’s time to manage the typical lost-time claim. This typical claim is compensable, un-represented, results in disability beyond six (6) weeks but less than twenty-six (26) weeks, and does not involve any medical or legal disputes. If all claims handled by a hypothetical adjuster were normal, and if completion of the identified tasks is a requirement for timely case closure, then our hypothetical adjuster should handle a maximum of 111 claims. The industry norm suggests that this adjuster can handle between 175 and 200 claims. In order to achieve the same results, this adjuster would be asked to accomplish 1575 hours of work (9 hours @ 175 cases = 1575 hrs.) during a 1000 hour work period (26 weeks @ 40 hr/wk = 1000 hrs.) Asking the impossible is not only poor claims management, but it also can have a significant adverse effect on what an employer pays for workers’ compensation coverage.
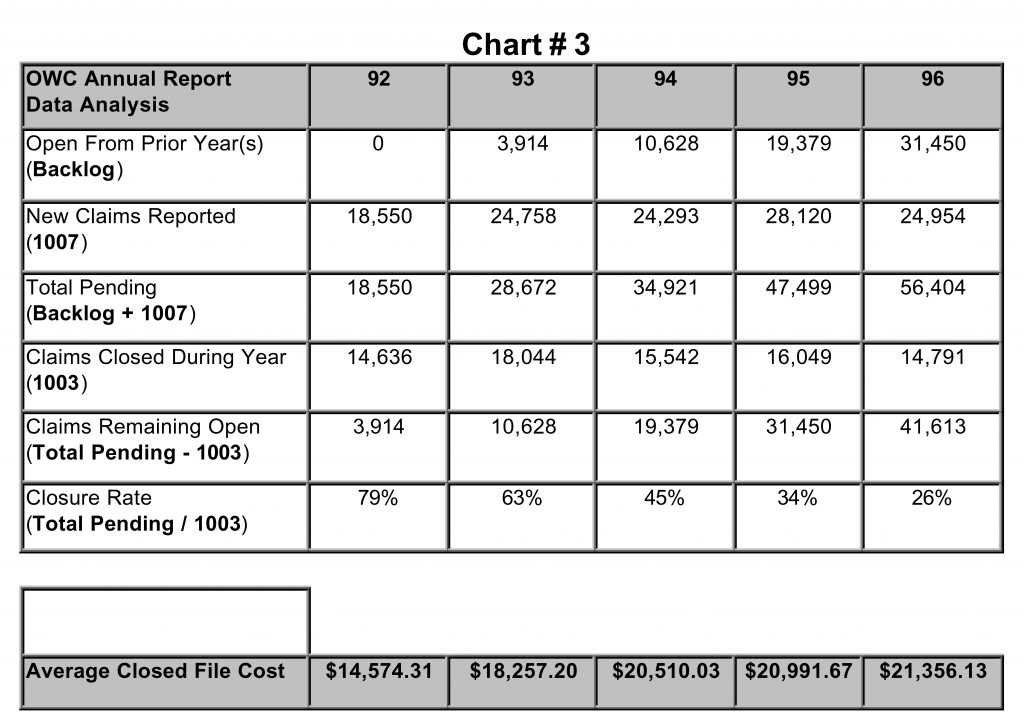
Chart #3 was compiled from information published by the Louisiana Department of Labor Office of Workers’ Compensation. In the annual report, the department shows the number of new claims reported during the year (1007) and the total number of all claims closed during the year including the total amount paid on the closed cases. The number of open claims from the prior year was computed by subtracting the claims reported closed during the year from the Total Pending. It appears from the OWC data that the state’s open claims backlog is growing. The closure rate for 1996 was a low 26%, with an average closed claim cost of $21,356.13. In 1996 the case study group closed 83% of its pending caseload and 49% of new claims for a combined closure of 132%. The five-year closure rate for this study group is 82% with an average closed claim cost of
$11,289.59.
Conclusion:
The State of Louisiana does not set training or caseload standards for claims adjusters. Adjusters in Louisiana are not licensed and cannot be licensed. There are many well-intentioned people who work as claims adjusters, but the consumer has no way of knowing if the person handling their claim(s) meets minimum training and caseload standards. Under our present system, we allow workers’ compensation judges to award penalties and attorneys’ fees allegedly for poor claims handling practices. Penalties and attorneys’ fees have become a gold mine for plaintiff attorneys and a hidden claim’s cost for the consumer. Licensing adjusters and setting training and caseload standards would be a step toward recognition of the vital role that the claims adjuster occupies in the workers’ compensation arena. Establishing professional adjuster standards should add an additional element of adjuster accountability to the cost control equation
